C++ Algorithmic Trading Suite
About:
This
project is a work in progress. The source code will be posted when it is
finished.
This is a
collection of programs to help develop and test stock trading
algorithms. These programs work with the Interactive Brokers C++ API. Interactive Brokers supplies the real-time tick data, and allows you to trade in a virtual stock market game.
An
Interactive Brokers account is needed to use these programs. Students
can get a free paper-trading account
to trade virtual currency. Non-students must fund an account with
$25,000. The $25,000 minimum is enforced by the stock exchanges for
automated computer trading accounts. Alternatively, non-students can try
Interactive Brokers with the demo account. I have not tried the demo
account, but it may impose stricter limitations on the amount of data
you can request. The following is the login information for the demo
account:
Username: edemo
Password: demouser
The programs in this collection help with three main tasks:
- Recording data
- Testing
- Analyzing test results
The following is a list of the programs, and their general purposes:
- Record - records tick data for requested stocks
- Simulate - runs a strategy on either real-time or pre-recorded data
- Plot - plots recorded data, and simulation results
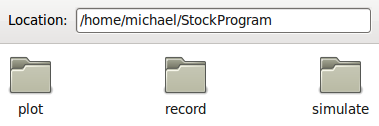
A folder for each program
Program previews
The record program is used to get data for the simulation. Interactive Broker's Trader Workstation (TWS) must be running simultaneously with this program.
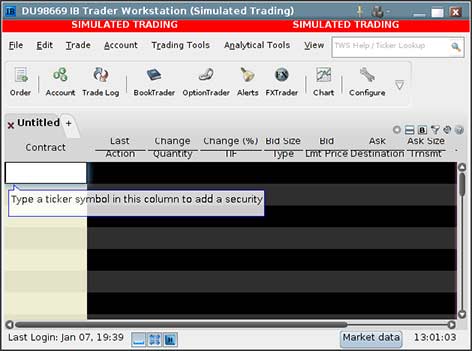
Screenshot of IB's TWS program
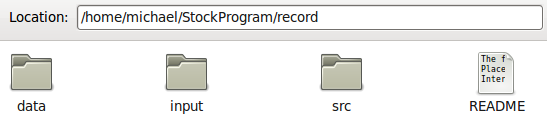
Folder structure for the record program
A file called "input.txt" is placed in the input folder. This file has
one stock symbol per line. Interactive Brokers allows you to
simultaneously monitor up to 100 different stocks. A folder is created
inside the output folder with the current date. Inside this folder is a
separate text file for each stock. The following is a sample of recorded
data for Google (GOOG):
1294412680.442966 last_price 616.300000
1294412680.443007 last_size 1
1294412680.443023 last_size 1
1294412680.443679 last_price 616.300000
1294412680.443700 last_size 1
1294412680.443714 last_size 1
1294412680.444169 volume 3729
1294412680.479466 bid_price 616.020000
1294412680.479482 bid_size 5
1294412680.479496 ask_price 616.300000
1294412680.479511 ask_size 9
The first number is the unix timestamp with microsecond precision.
Following the timestamp is a property and value. Interactive Broker's
alerts our program whenever the stock's behavior changes. This could be a
change in pricing, or activity.
The record
program can be setup to automatically run on weekdays from 9:30 AM to
4:00 PM. This is the easiest way to record daily data. The first step is
to boot into your computer's bios settings. Most computers have a
setting to turn on at a specific time. Enter the time to wake up as
9:25.
The hardest
part of automating this program is getting TWS to startup
automatically. This is because TWS requires you to enter your username
and password prior to logging in. Thankfully, someone has created a
program called IBController to automate the process. After installing and configuring IBController, you must modify how TWS launches.
Open the
file "TWS.sh" located in your iBrokers/IBJts folder. Change the
following line from:
java -cp jts.jar:hsqldb.jar:jcommon-1.0.12.jar:jfreechart-1.0.9.jar:jhall.jar:other.jar:rss.jar -Xmx512M jclient.LoginFrame .
to
java -cp jts.jar:hsqldb.jar:jcommon-1.0.12.jar:jfreechart-1.0.9.jar:jhall.jar:other.jar:rss.jar:/home/michael/IBController/IBController.jar ibcontroller.IBController your IBController .ini file your-username your-password
Be sure to modify the parts in bold. If everything is setup correctly,
TWS should start and login automatically when you run TWS.sh.
Now, we
need to setup a cronjob to run TWS.sh on weekdays at around 9:27 AM.
Type the command "crontab -e" into a terminal. Add the following
cronjob:
# m h dom mon dow command
#on weekdays start TWS at 9:27 AM
27 09 * * 1,2,3,4,5 env DISPLAY=:0 /home/michael/iBrokers/IBJts/TWS.sh
Your computer should now automatically boot, and start TWS before 9:30
AM. Now, create a shell script, and have it run the record program. The
final step is to add another cronjob to run the new shell script at
about 9:29 AM.
The
simulation program allows you to specify the name of a folder containing
recorded data. For example, the command "./simulate Fri_01-07-2011"
will run the simulation using all of the recorded data for that date.
Optionally, you can specify a single stock to run the simulation
against: "./simulate Fri_01-07-2011 GOOG".
A blank
strategy template will be included in the release. The strategy template
contains basic functions to interact with the simulation. For example,
there is a function named gotNewData(Data *d) that is called whenever
the simulation program gets a new line of data. The Data object contains
the information such as the time, stock symbol, property, and value.
The makefile compiles a different executable for each strategy you
specify.
The plot
program allows you to view recorded data. The arguments to specify are:
property to plot, date of data, and stock symbol. For example, the
following command will plot Google's last_price data recorded on
01-07-2011:
./plot last_price Fri_01-07-2011 GOOG
The program generates a ".dat" file of the data you want to plot.
Gnuplot is then used to display the data. ".dat" files were used instead
of static images so that the user can zoom in and out of the graphs.
The following image shows a comparison of last_price data for Google's stock.
Google finance vs. recorded data
The graph on the left is a chart from Google's finance website. The other plots were generated from recorded data. The axes of all graphs are different, but the left and middle graphs show the same large price drop. The right-most plot is a zoomed in view of the tip of the large drop. This shows the extreme detail of the recorded data from Interactive Brokers. You can pay monthly for faster data feeds, but they are costly.
To do list:
- The record program will grab data from previous days. The limitation is that Interactive Brokers only allows you to make a certain number of requests in a given time period. Additionally, the history tick data is not as detailed. It is at one second intervals.
- The majority of the simulator is not done. It needs to log all the orders executed and track the results.
- The plot program will display simulation results on graphs. It will mark where the simulation bought and sold.
- documentation
- bug testing
- write a strategy (the hardest part)